Warning
You are reading an old version of this documentation. If you want up-to-date information, please have a look at 1.1 .3. Results
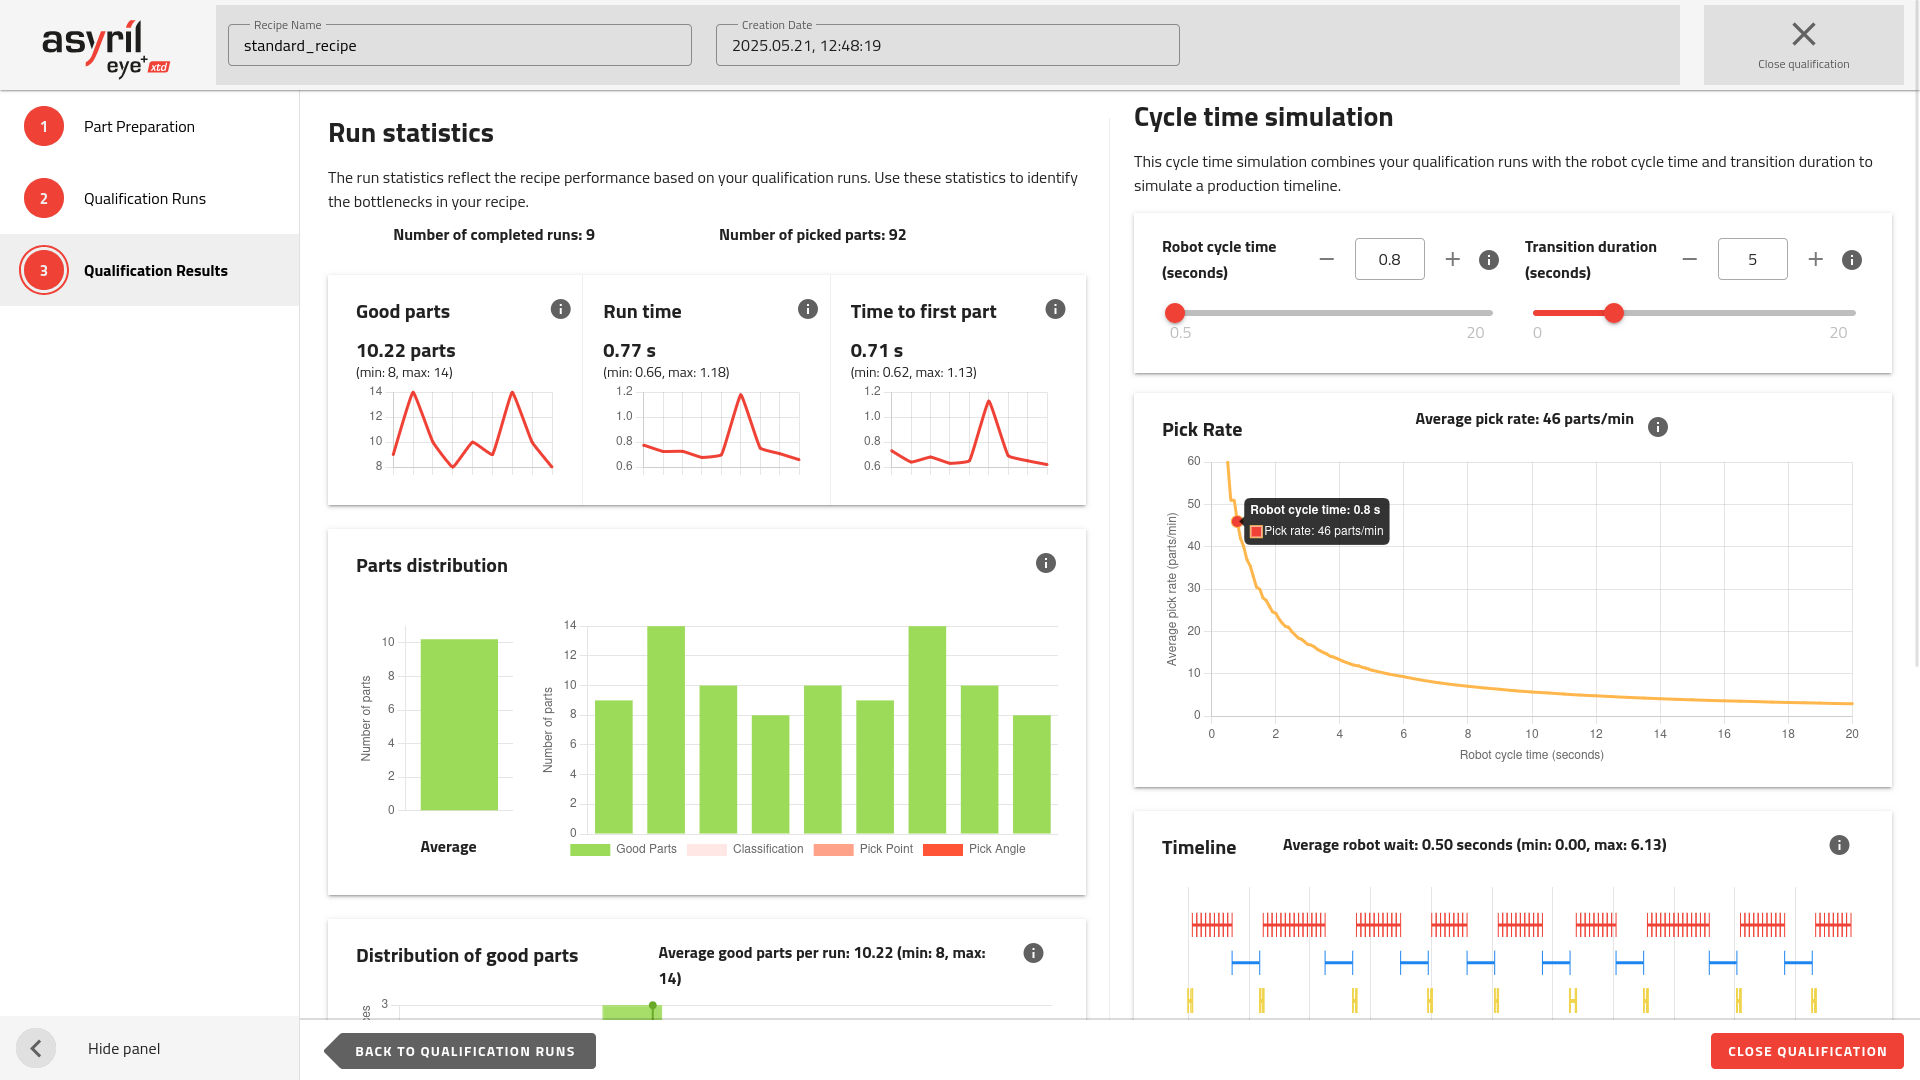
Fig. 119 Qualification Results
This page uses all the collected information and displays it as a summary of all the runs that you performed in the previous step. Then, it allows you to adjust some parameters to simulate a production timeline.
Run Statistics
The run statistics are a reflection of the recipe performance based on the qualification runs.
Tip
These statistics are really useful to identify the bottlenecks in the recipe.
Tip
You can add more runs by going back to the previous step (all previous data is kept).
Good parts
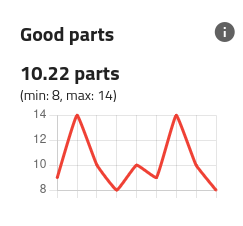
Fig. 120 Run Statistics - Number of good parts
The chart displays the evolution of the number of good parts detected over all qualification runs.
The average value of this metric over all qualification runs is displayed below, as well as its minimum and maximum value (in brackets).
Run Time
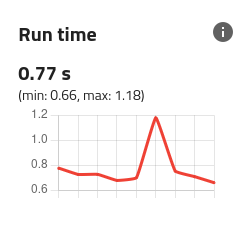
Fig. 121 Run Statistics - Run time
The chart displays the evolution of the time the system took to complete a run (complete image analysis).
The average value of this metric over all qualification runs is displayed below, as well as its minimum and maximum value (in brackets).
Time to first part
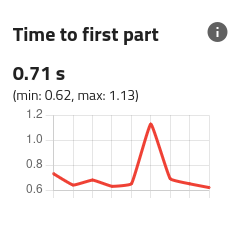
Fig. 122 Run Statistics - Time to first part
The chart displays how long the system took to find the first part during the last image analysis across all qualification runs.
The average value of this metric over all qualification runs is displayed below, as well as its minimum and maximum value (in brackets).
Part distribution
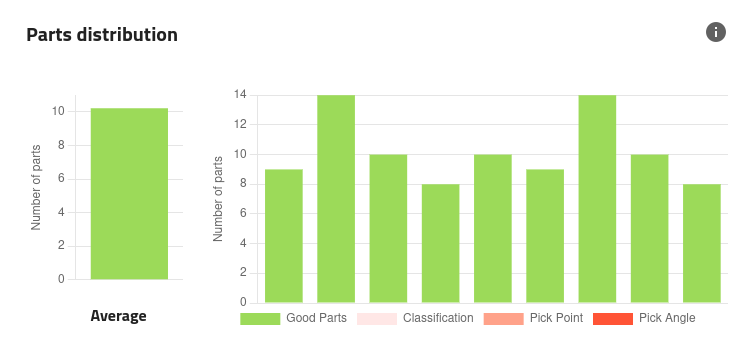
Fig. 123 Run Statistics - Part distribution
The chart on the right side displays the distribution of the parts between accepted and rejected for each qualification run.
The chart on the left side displays the average distribution over all qualification runs.
Tip
Use these charts to identify what step of the recipe could be improved.
Distribution of good parts
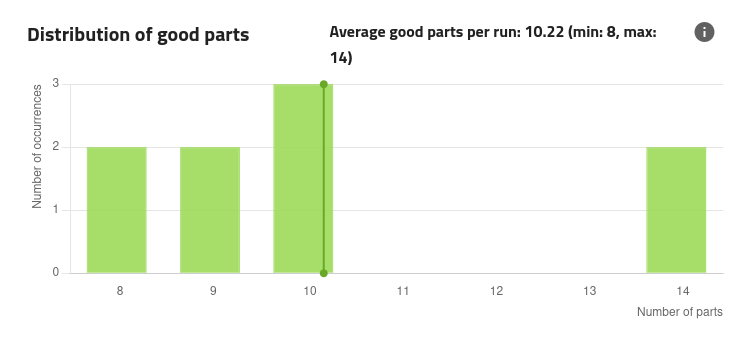
Fig. 124 Run Statistics - Distribution of good parts.
This chart displays the distribution of the number of good parts measured during the qualification runs.
Distribution of time to first part
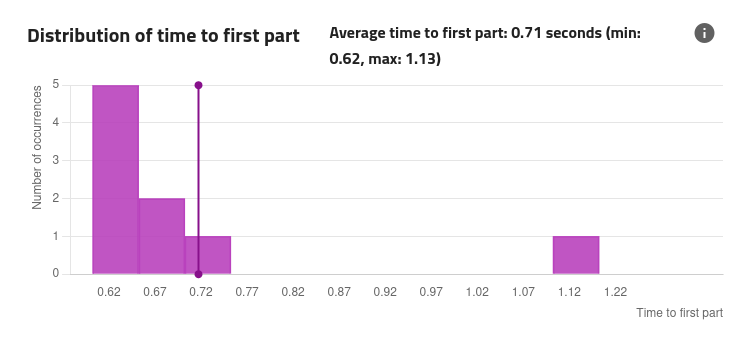
Fig. 125 Run Statistics - Distribution of time to first part.
This chart displays the distribution of time to first part during the qualification runs.
Note
The average number of good parts per run gives an indication about how frequently this waiting will occur.
Tip
To improve this time, consider reducing the number of bad parts reaching the candidate selection step and masking all unnecessary features on the pick-point and pick-angle teaching steps.
Cycle Time Simulation
This section combines the qualification runs with the theoretical robot cycle time and the transition duration to simulate a production timeline.
Use it to assess what impact would the image analysis have on your production timing.
Robot cycle time
In order to compute the simulation, the robot cycle time must be entered. This value can be changed to monitor the impact on the pick rate and the robot wait.
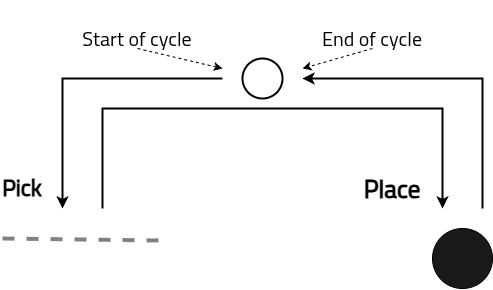
Fig. 126 Illustration of the robot pick and place cycle
Transition duration
The transition duration is the time it takes for the system to transfer new parts to the picking area once all parts have been picked by the robot. During this period, no pick and place operations occur, and EYE+ XTD waits for a production command (e.g., get_part) to initiate a new image acquisition and analysis.
A shorter transition duration allows for a higher number of parts processed per minute.
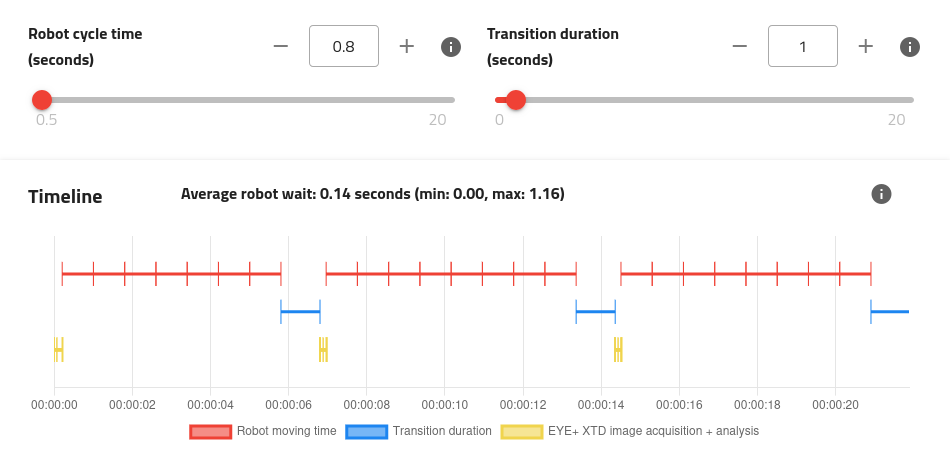
Fig. 127 Timeline with 1s transition duration
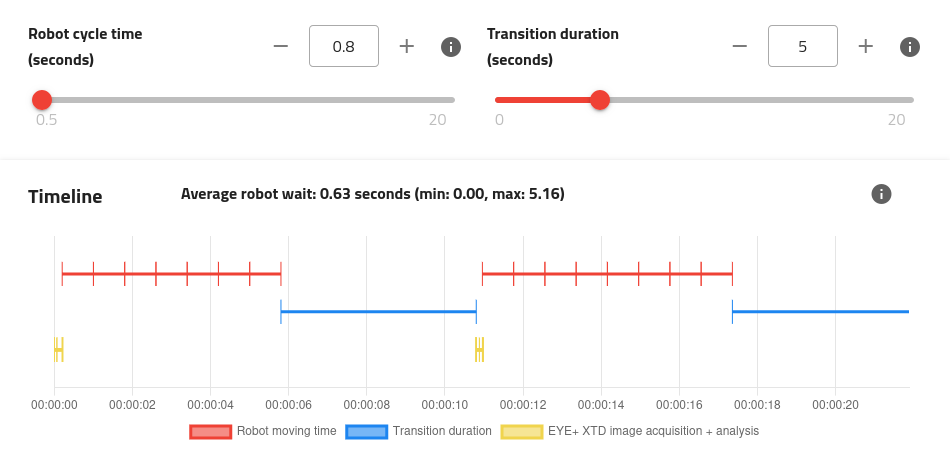
Fig. 128 Timeline with 5s transition duration
Pick Rate
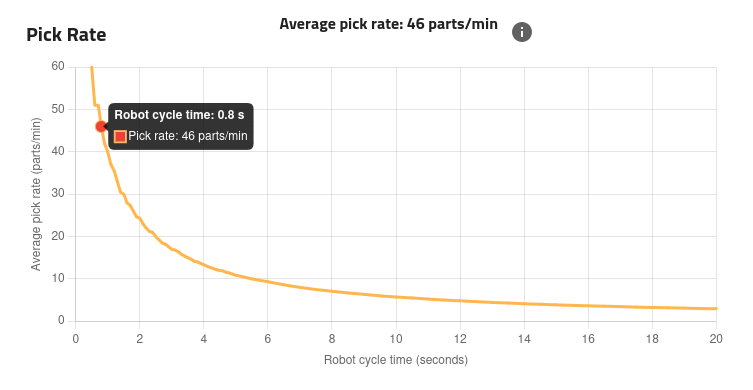
Fig. 129 Cycle time simulation - Pick Rate
The pick rate is calculated using the data from the qualification runs and will vary when changing the transition duration.
You can determine from this graph the robot cycle time you will need to reach the desired pick rate.
Timeline
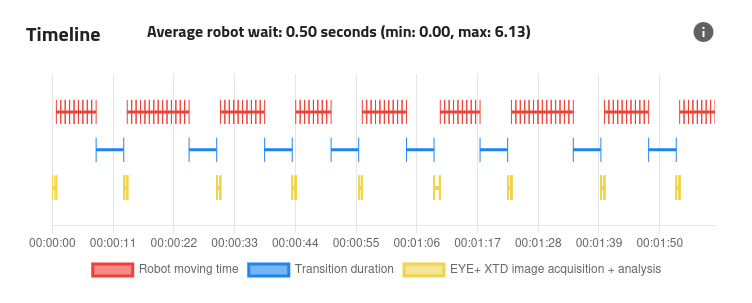
Fig. 130 Cycle time simulation - Timeline
The timeline contains three different tracks:
The top track represents the robot’s activity.
The middle track displays the transition duration.
The bottom track is dedicated to EYE+ XTD’s activity.
The robot track illustrates when the robot receives a response to a get_part command and executes a pick and place cycle. The duration of this cycle can be adjusted within the simulation using the dedicated field.
Tip
You may zoom/pan on the timeline to focus on specific points in time using your mouse.