Warning
You are reading an old version of this documentation. If you want up-to-date information, please have a look at 1.1 .3.4 Results
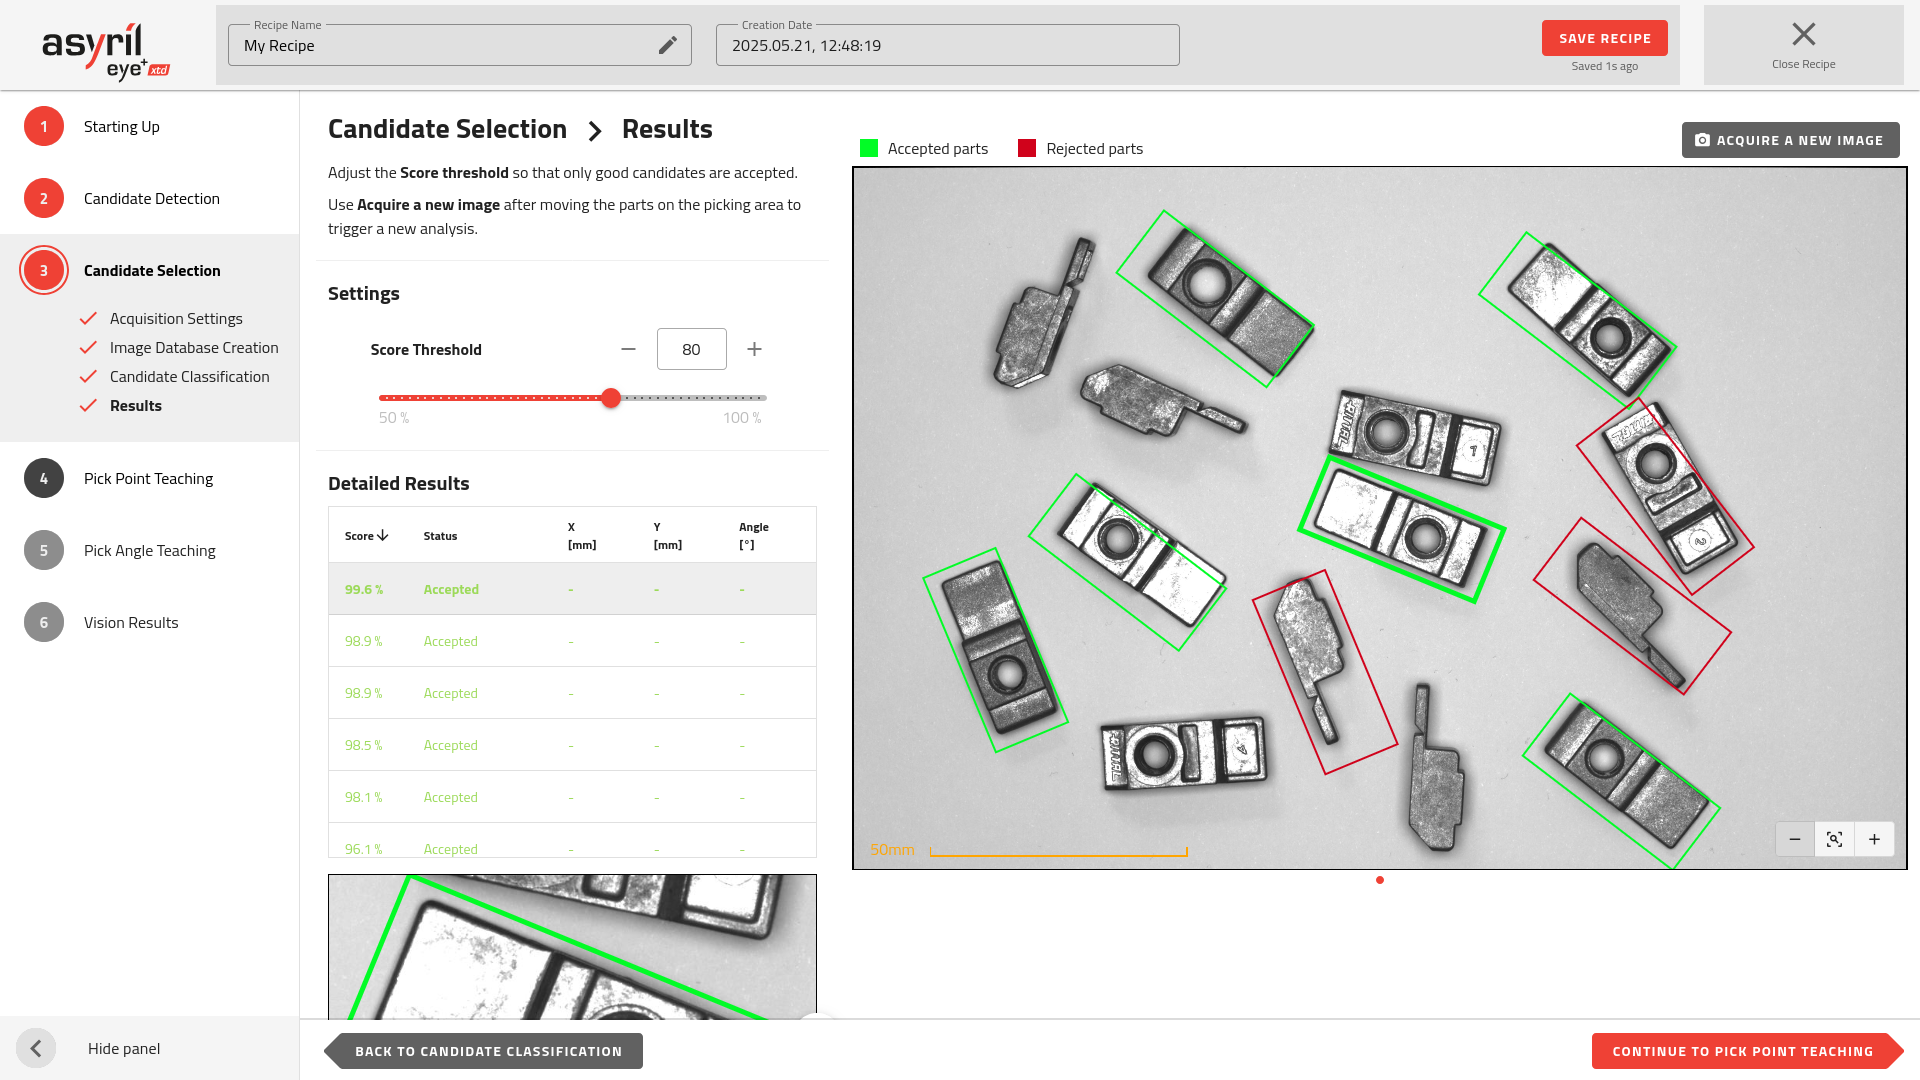
Fig. 84 Candidate Selection - Results
This page displays the results of your classification. A successful classification is indicated by a clear difference in scores between accepted and rejected parts. For example, good candidates may have a score of 88.4%, while bad candidates have 12.2%. This score represents the probability that a detected part matches the profile of a good candidate.
By default, the score threshold is set to 80%, meaning parts with a score below 80% are classified as bad candidates (i.e., bad orientation) and are rejected by the algorithm. You can adjust this threshold to better match your application and avoid misclassifying poorly oriented parts as good candidates.
Green rectangles: accepted candidates
Red rectangles: rejected candidates
Note
Adjusting the threshold often involves balancing the risk of rejecting good parts (false negatives) or accepting bad ones (false positives). Increasing the number of classified images can improve the algorithm’s robustness if the gap between good and bad candidates is not significant.
Tip
You can manually move the parts on the picking area and press Acquire a new image to analyze a fresh image and verify if the classification is working as expected.
Tip
In the results table, you can sort the parts by score in ascending order. This helps you quickly verify that all parts above the threshold have the correct orientation. Adjust the threshold as needed to ensure only good parts are surrounded by green rectangles.